
Max Agut's TPRNo6 Disqualification Report
October 13, 2026

Result:
Max Agut (001) is disqualified from TPRNo6 for breaching rule 4 – “All forward travel must be human powered”. He is furthermore banned from entering all Lost Dot events.
Sequence of events:
Control Team 1 (Race Director Andrew Phillips, Reporter Stuart Downie, Photographer Tomas Montes) saw Max riding while holding onto the driver's side door of a small white van on the Col d’Aubisque, between Eaux-Bonnes and Gourette just before 19:15 CEST on 27th September 2026. When the control team rounded the corner Max was seen holding the door for approximately 2 seconds, before he turned around, spotted the control car, and immediately dropped back.
Control Team 1 then passed Max and followed the vehicle up the Aubisque but the van did not stop. Race Director Andrew then stopped Max in Gourette and asked for an explanation. Max told Andrew that he had almost been knocked off by the white van, had been spat at in the face, and was arguing with the driver when the control car appeared. Andrew then asked for power data to be sent to the rider comms manager for examination.
Max continued on his way along the Raid parcours, before crashing at around 07:25 CEST on 28th September 2026. He later scratched and was medically examined for concussion.
As the result of this scratch, the investigation has had no bearing on TPRNo6 race results, and we have chosen to let the race finish so we could conduct a thorough investigation and allow the other riders of the Trans Pyrenees Race to finish the race without it becoming a circus of gossip and speculation.
Having now analysed the ride data in detail, Lost Dot concludes that Max was assisted on two climbs by holding onto a vehicle. The data below shows that Max was aided by a vehicle for approximately 9 minutes on the Col d’Aubisque, and 15 minutes on the Col de Marie Blanque; the estimated time saved by receiving motor assistance on these climbs, and by travelling at roughly twice his normal climbing speed, was 24 minutes in total. This conclusion is supported by the data provided by the rider, and is based on an analysis of his power, speed, and elevation data. This is demonstrated below with a brief analysis and further evidence annexed at the end.
Evidence of motorised assistance on the Col d’Aubisque
Power
The power data provided by the rider shows clear evidence of motorised assistance.
The table below (Table 1.1) compares the rider’s recorded power output with the rate of ascent gain (VAM) on four segments of road between Eaux-Bonnes and the point where the control car spotted him. The two figures are physically inconsistent. For the recorded power to produce that climbing speed, the combined mass of rider and bike would have to be only 20-35 kg.
Due to the physical limitations of a narrow road with other traffic, the rider was unable to hold on non-stop for this section, so the climb data below is split into segments where they were receiving assistance, and others where they were not.
The estimated time gained over those sections on Col d’Aubisque with assistance is about 9–10 minutes, in addition to the physical effort saved by riding for a cumulative time of ~9 minutes with assistance.
AI analysis (Claude, checked with ChatGPT) of the FIT file provided by the rider:
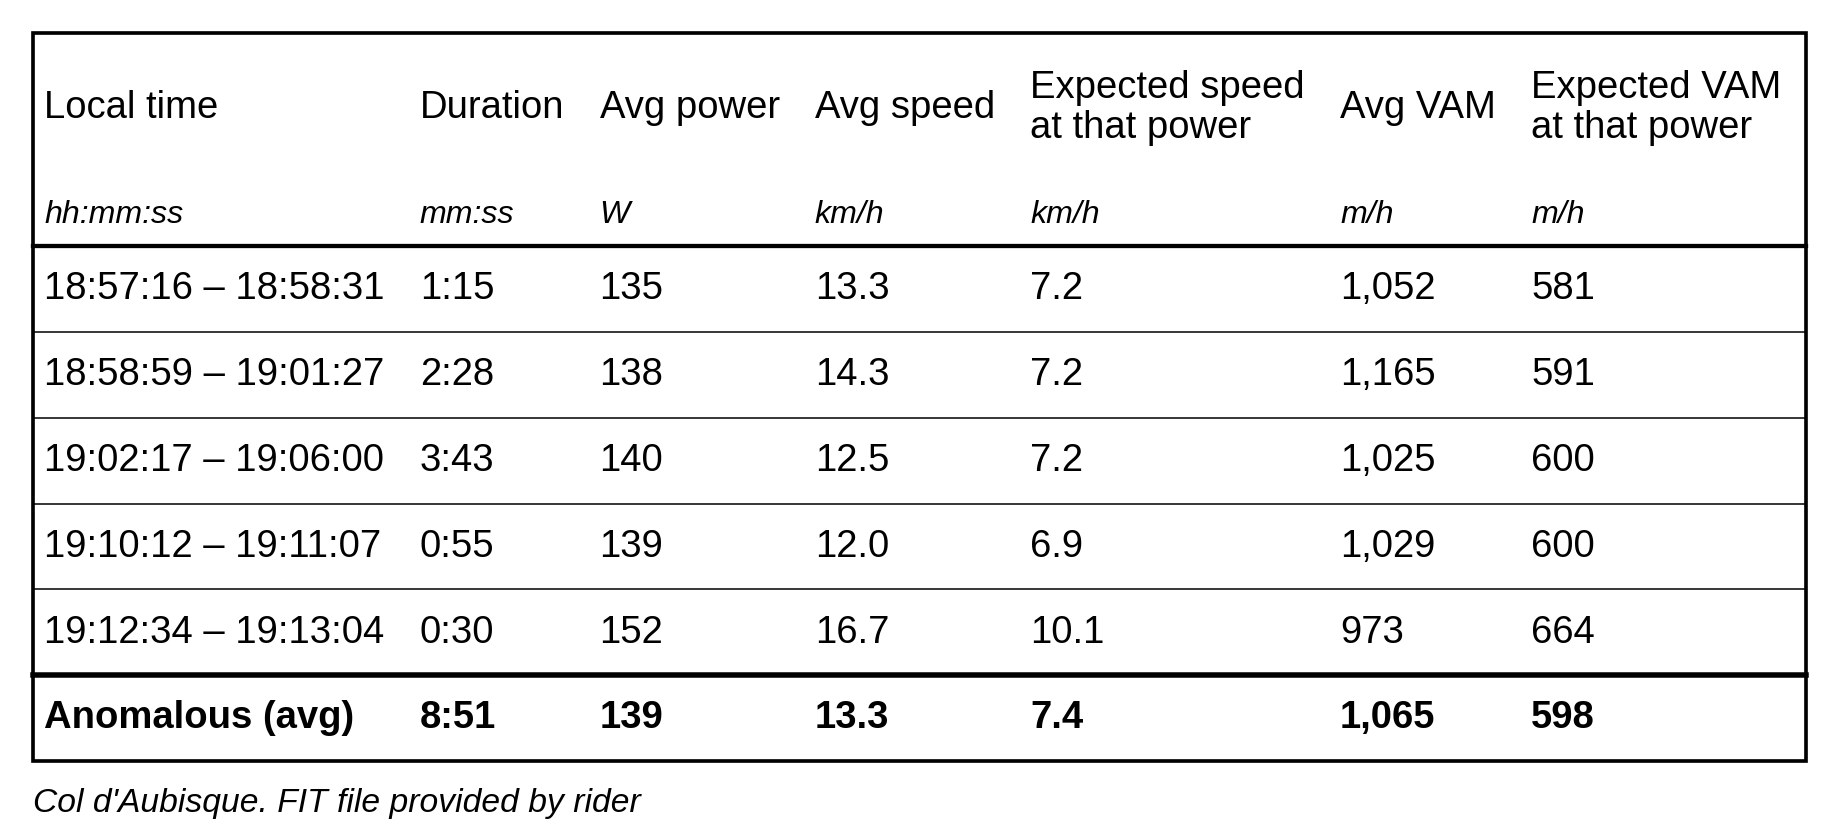
This table shows that the rider was doing roughly double the possible speed and rate of climb for the amount of power output. See Annex A for more detail.
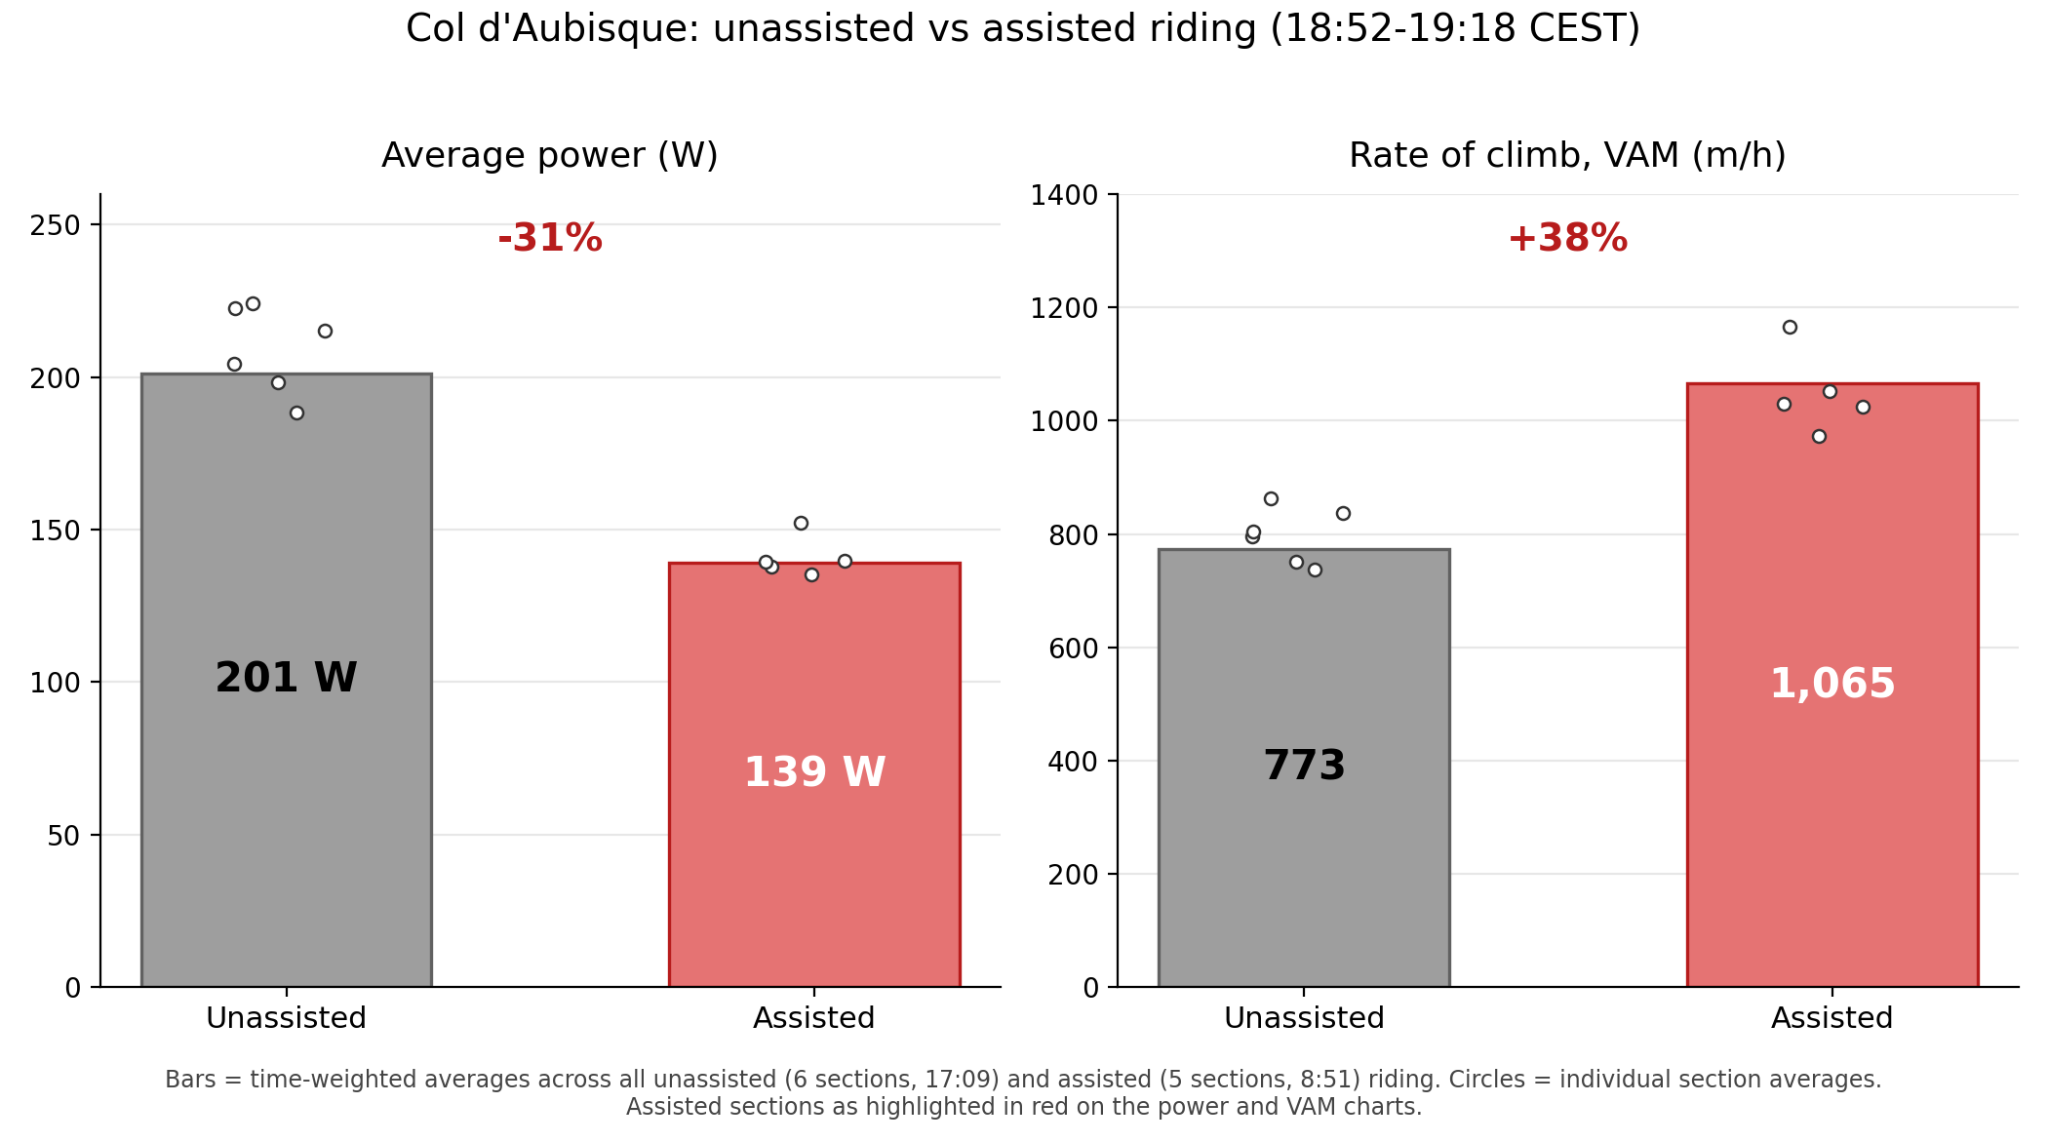
This graph shows that for segments where the rider’s power decreased, his rate of climb increased.
Col de Marie-Blanque
Extending analysis of the FIT file out to other climbs, we see a similar pattern two hours earlier the same day (17:02 CEST on 27th September 2026), on the Col de Marie-Blanque. A comparison of power data and climbing speeds on the climb show that the rider ascended the Col at physically impossible speeds without some external input.
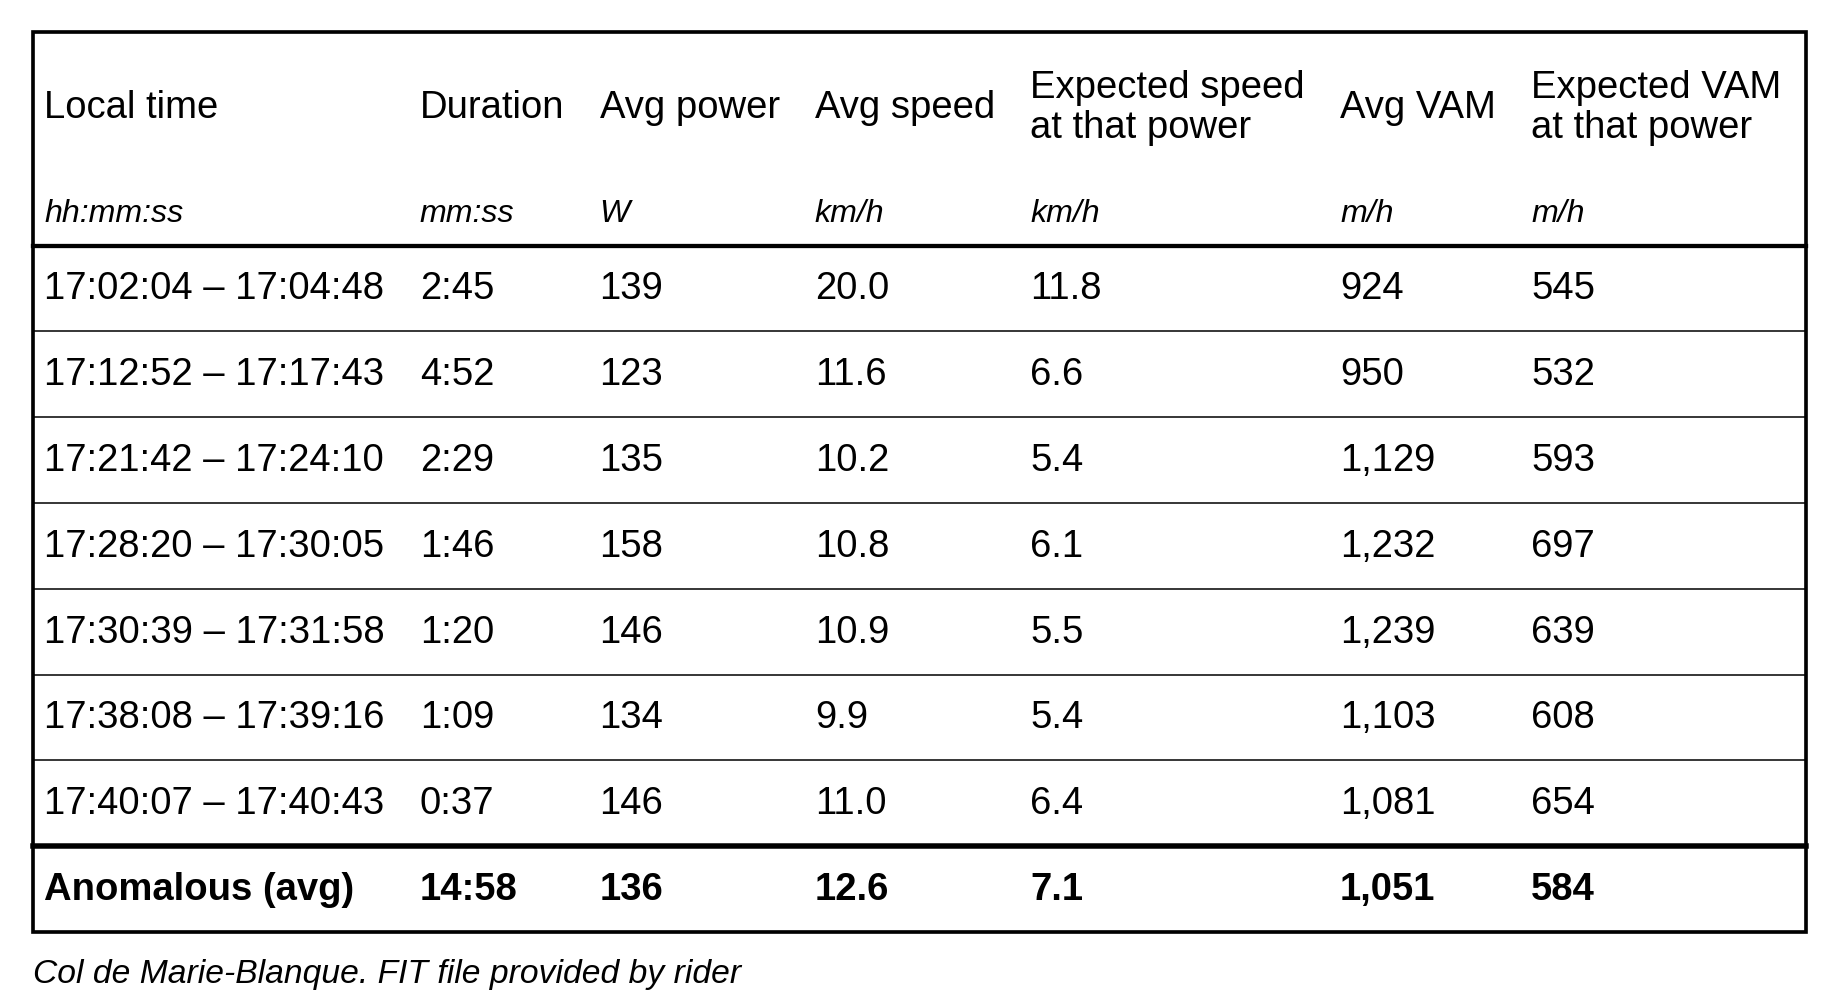
As on the Col d’Aubisque, speeds are roughly twice what they should have been for the power input. The time gained over those sections with assistance is calculated to be approximately 15 minutes, in addition to the physical effort saved by riding for a cumulative time of ~15 minutes with assistance.
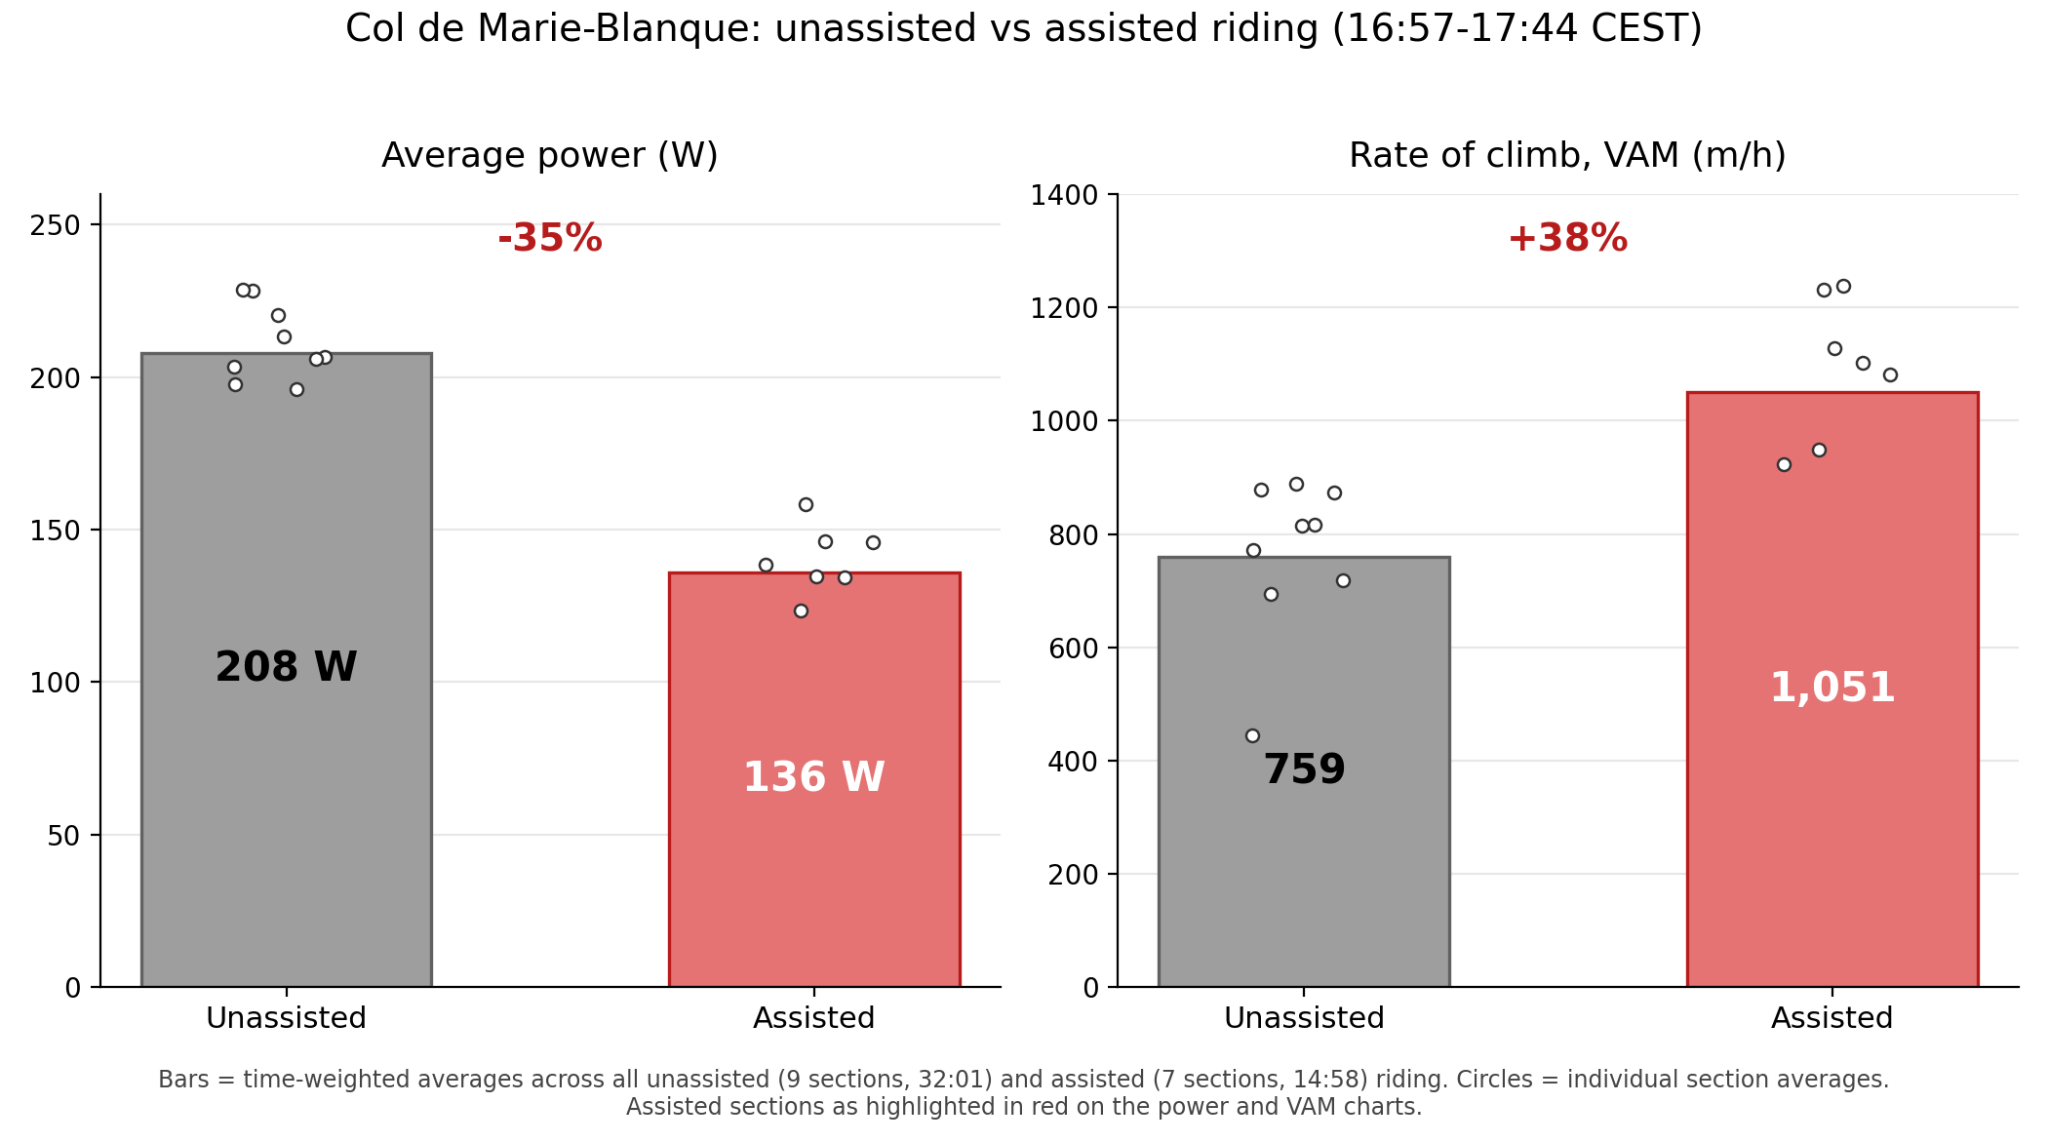
This chart shows that just as on the Aubisque, the rider’s power decreases by over 30%, whilst simultaneously increasing the rate of climb by over 30%.
Annex A - Further Analysis
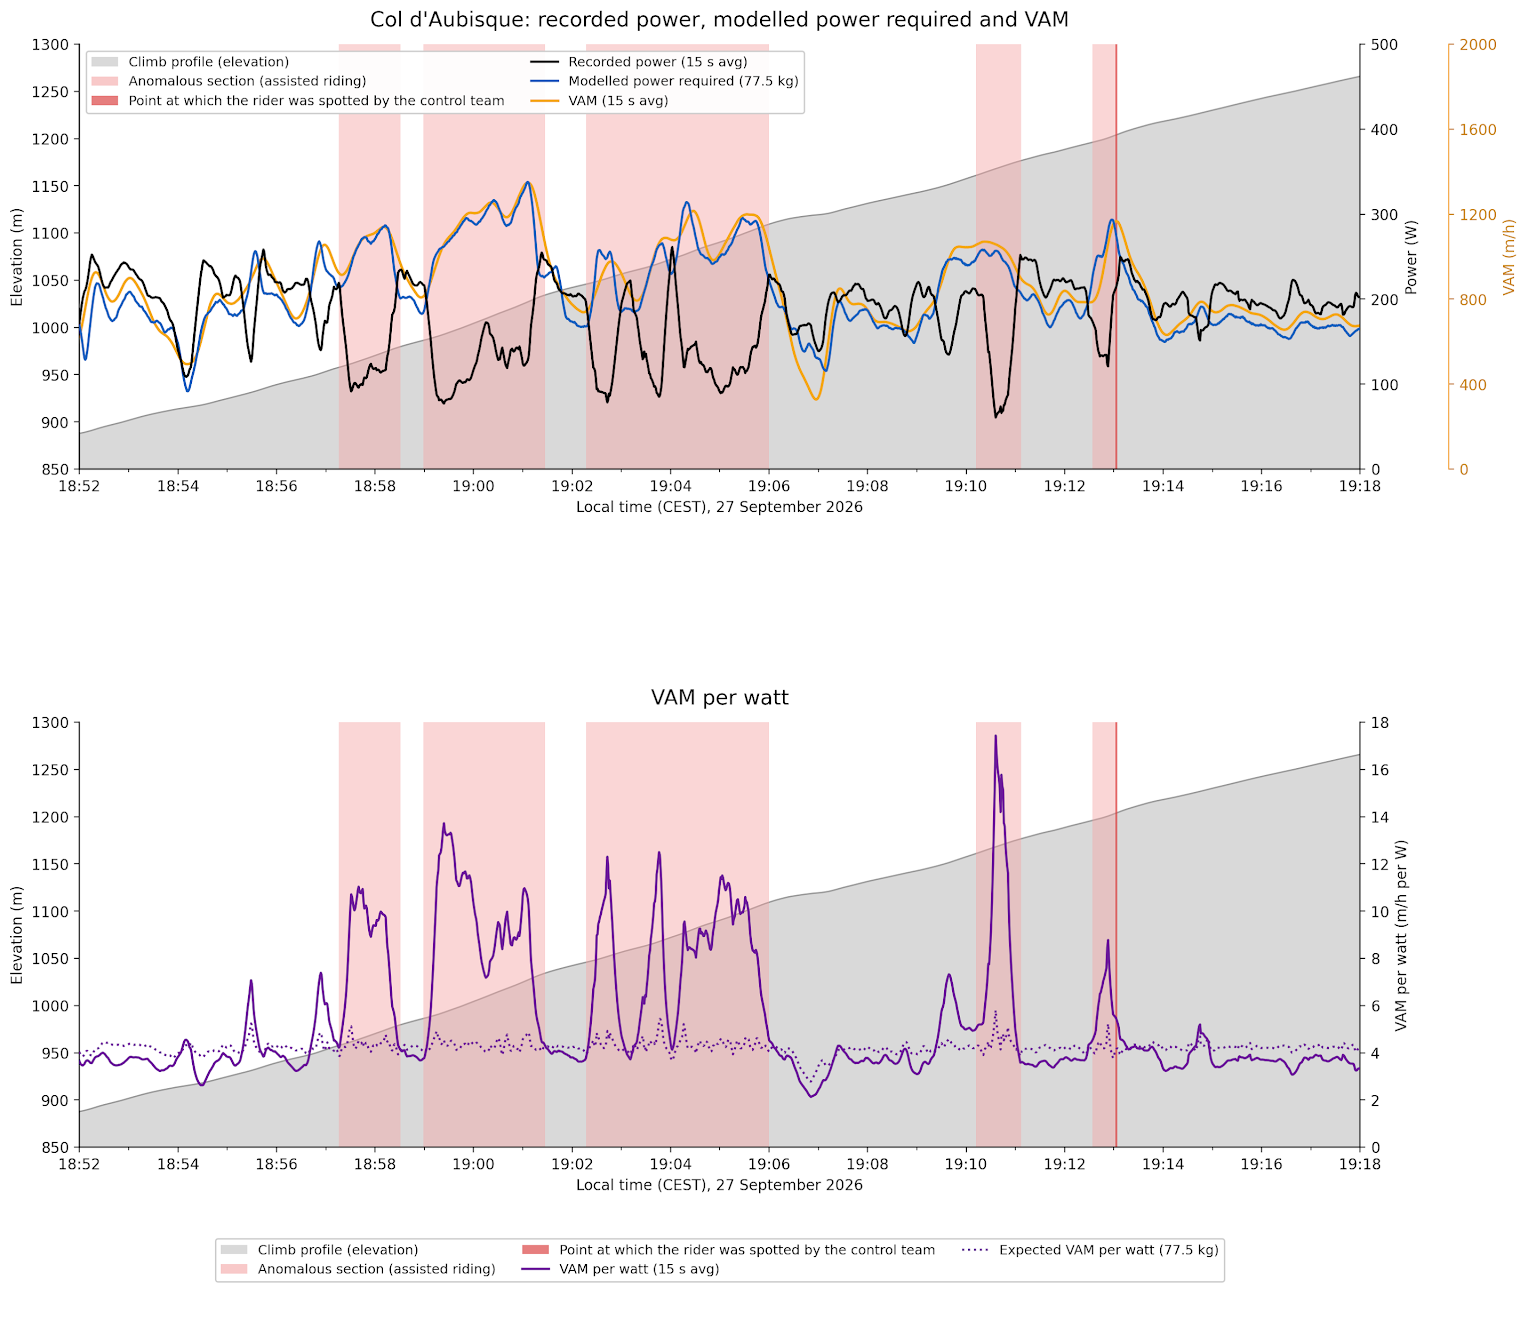
The first graph compares the rider’s recorded power output (W, black line) with the rate of ascent gain (VAM, yellow line), and the modelled power expected to climb at that speed (blue line) on five segments of road on the Col d’Aubisque between Eaux-Bonnes and the point where the control car spotted Max. The red highlighted sections indicate where Max received assistance. In these sections, the normally linear relationship between power and VAM is disrupted, and the rider’s power output is insufficient to account for the rider climbing at the recorded rate. The rate of ascent gain is modestly but noticeably increased to an average of 1065 VAM compared with the normal climbing rate of 773 VAM; meanwhile the average power output during assisted riding sections is 139 W, compared with an average power output of 201 W on unassisted sections.
The second graph displays the relationship between the rate of ascent gain (VAM) and the power output by the rider. During normal unassisted riding, the VAM per watt averages 3.8. While riding assisted by the vehicle, the VAM per watt averages 7.6.
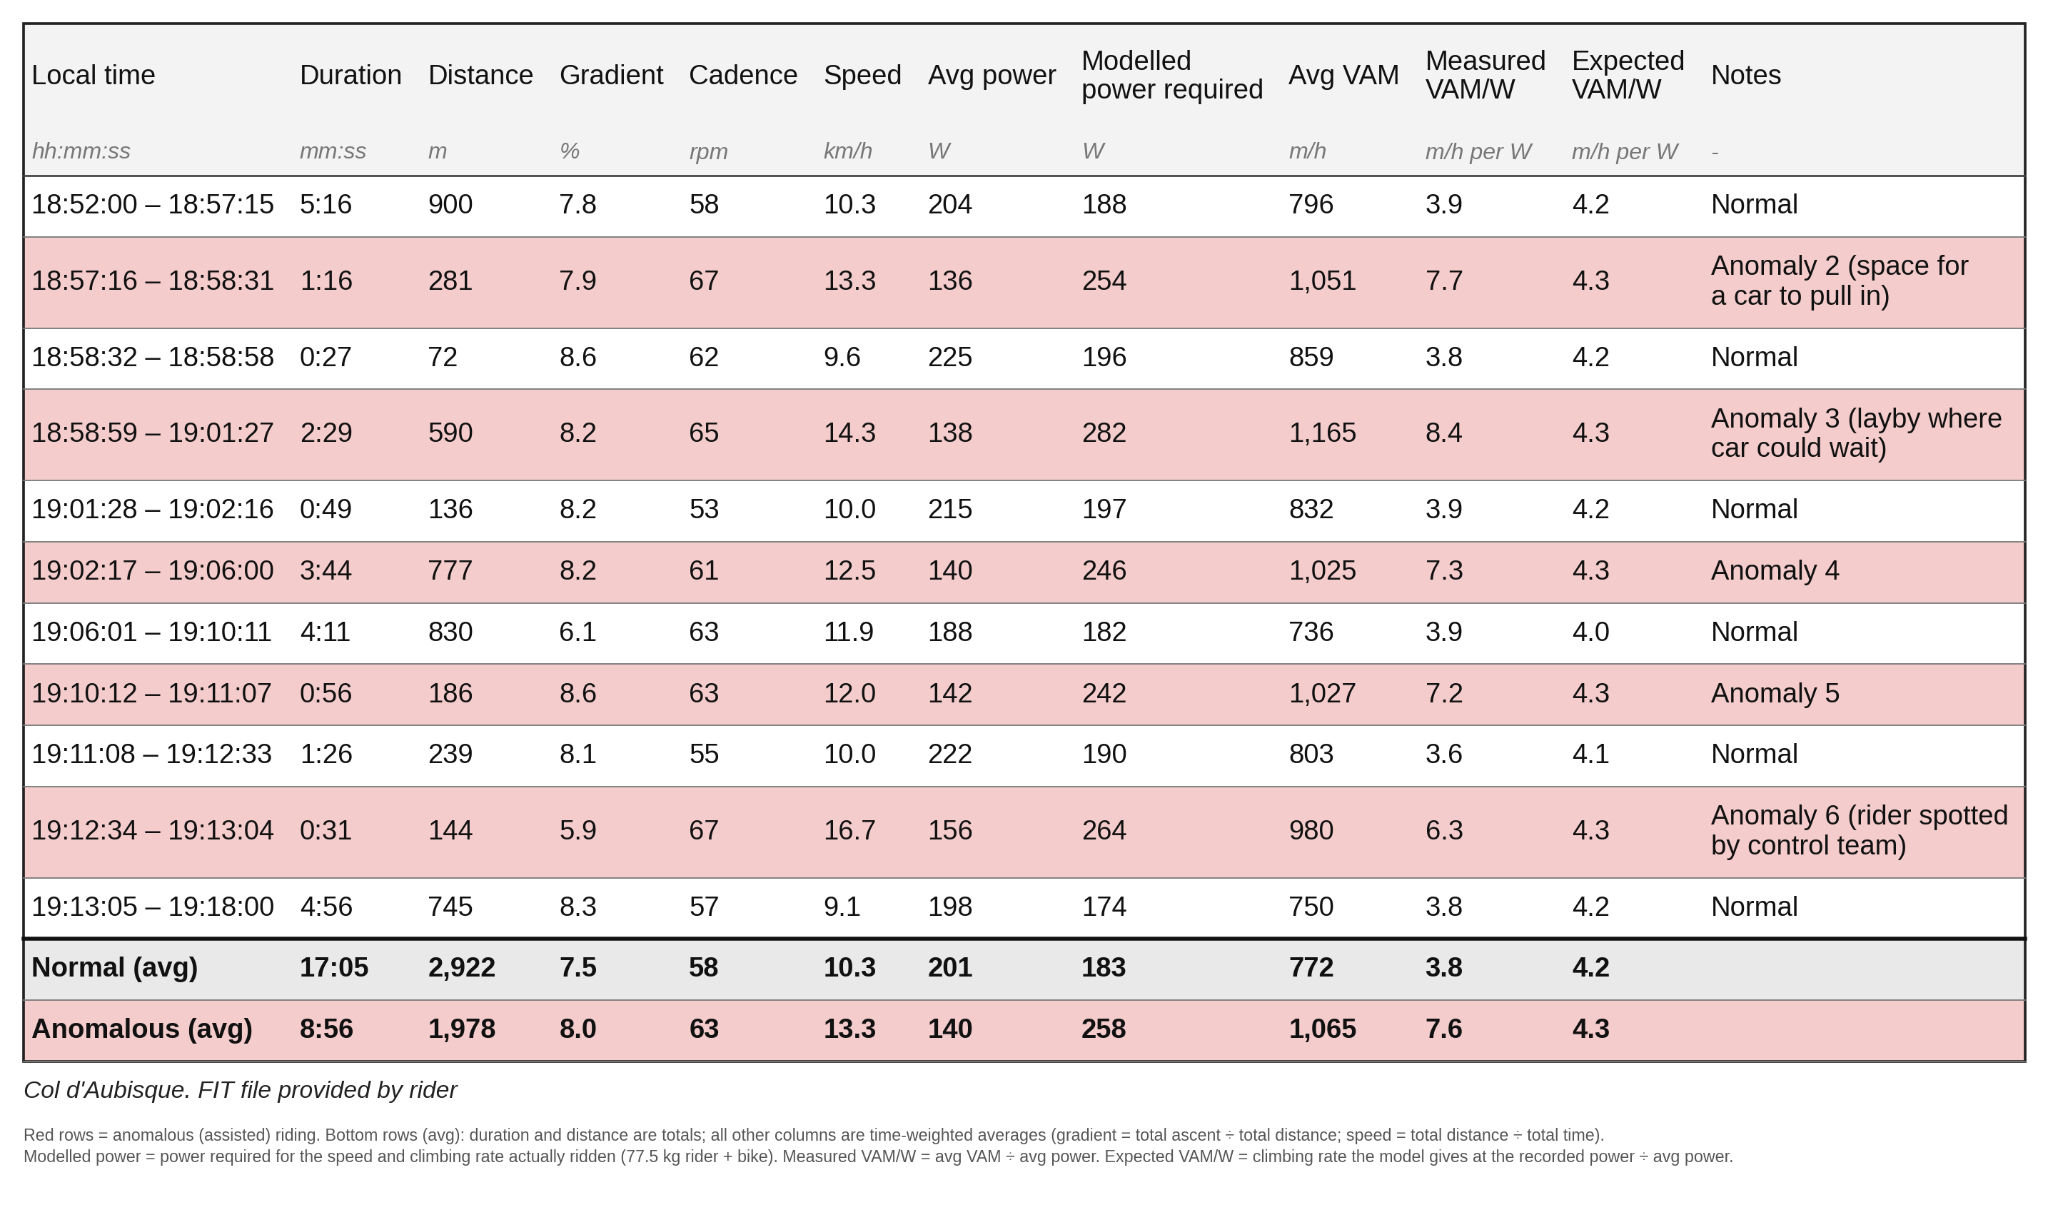
Table 2.1 In depth analysis of power data between Eaux-Bonnes and Gourette on the Col d’Aubisque. The interrupted nature of these segments is consistent with a rider holding onto a vehicle until another car needs to come past, at which point rider and vehicle separate, and the vehicle waits for the rider at the next pull-in. It is worth noting that the normal segments here closely match the model for expected speed and rate of climb, showing that the inputs (power, location data, barometer, etc) are functioning well and the model works. Anomalous segments (where climbing speed is unexplained for power input) are highlighted in pink. Note the higher VAM numbers in the pink rows, and the disparity between VAM and expected VAM.
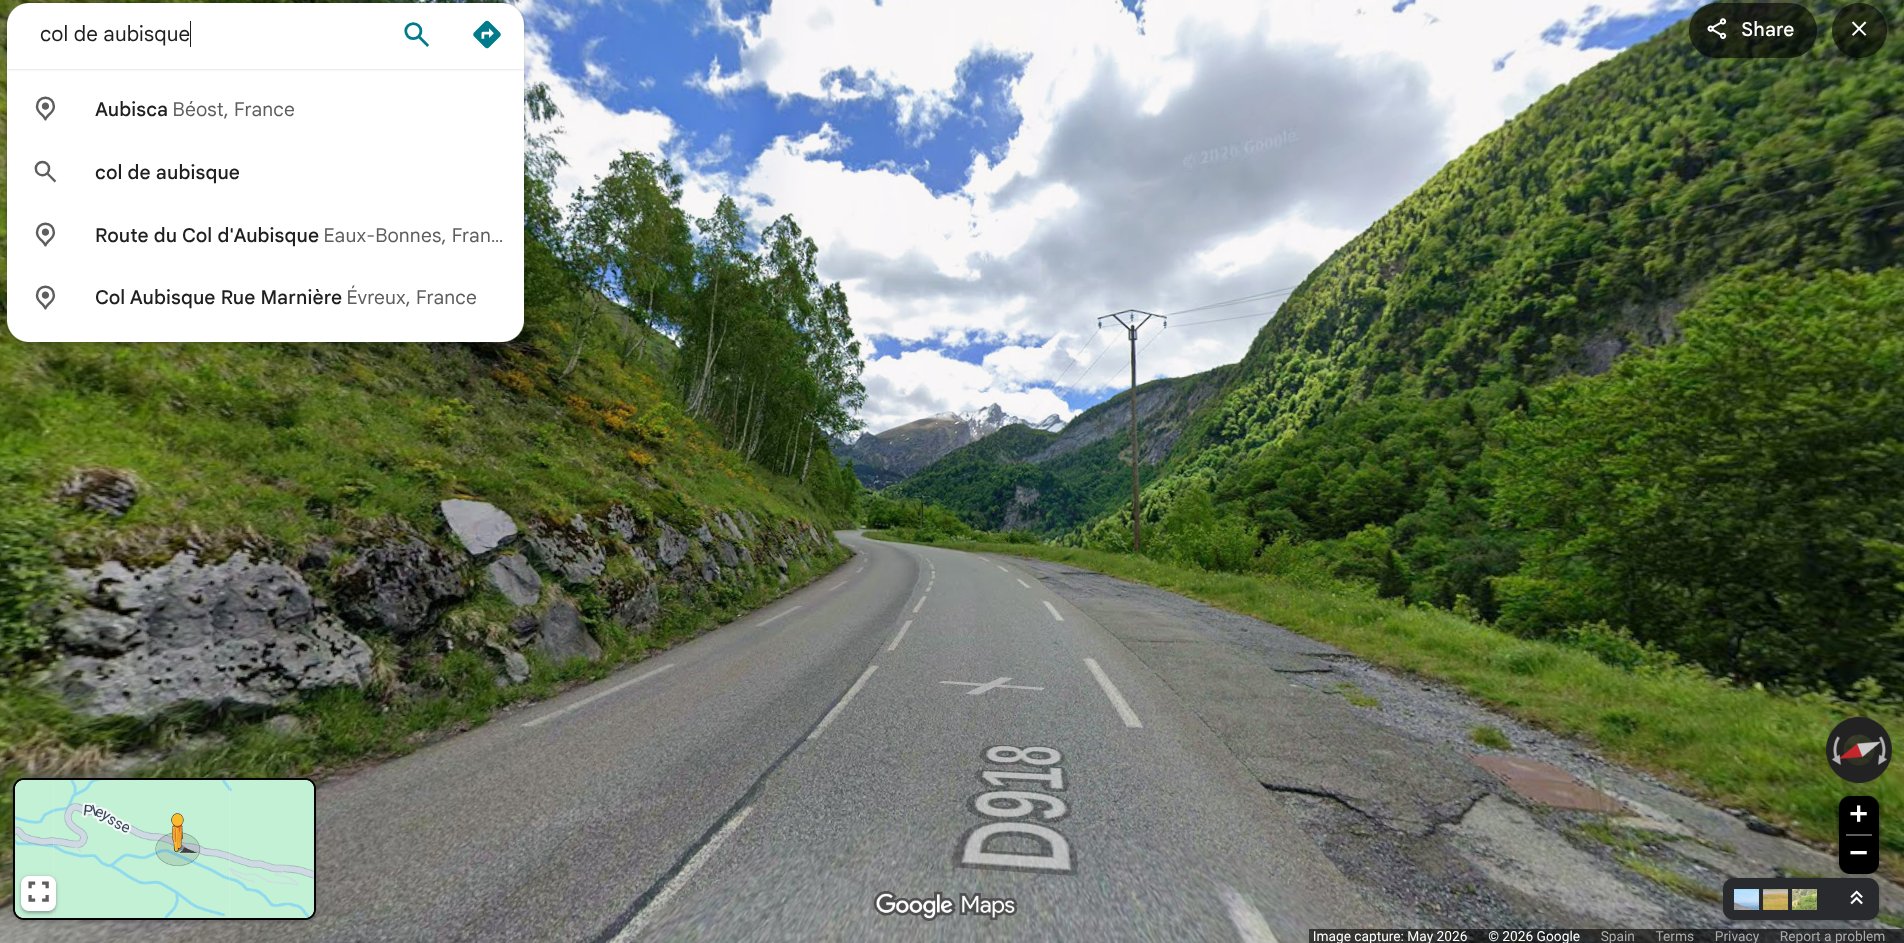
Photo 1 shows the location on the Col d’Aubisque where Anomaly 3 starts - showing a layby where a car could wait for a rider to catch up. From this point, the rider averaged 14.2km/h for 2:29 minutes at only 138w. Expected speed for this power is 6.3km/h.
Location: 42.967346, -0.365866
A visual representation of the anomalous segments can be found in Photo 2 (in orange) on the Aubisque. Refer to the map linked in the photo below:
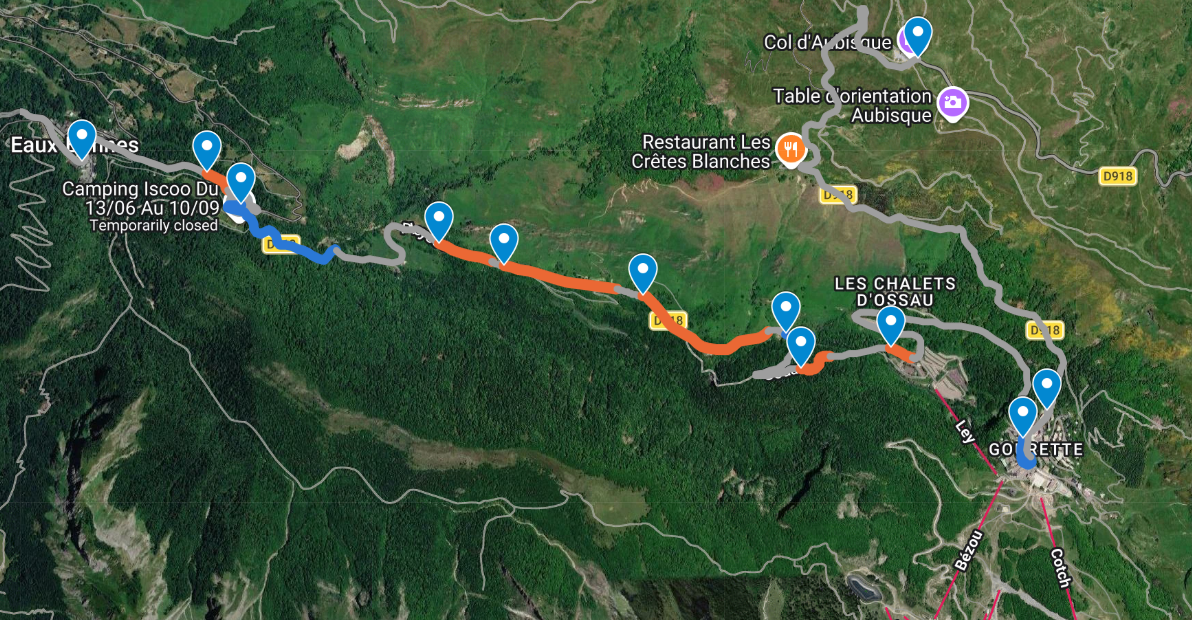
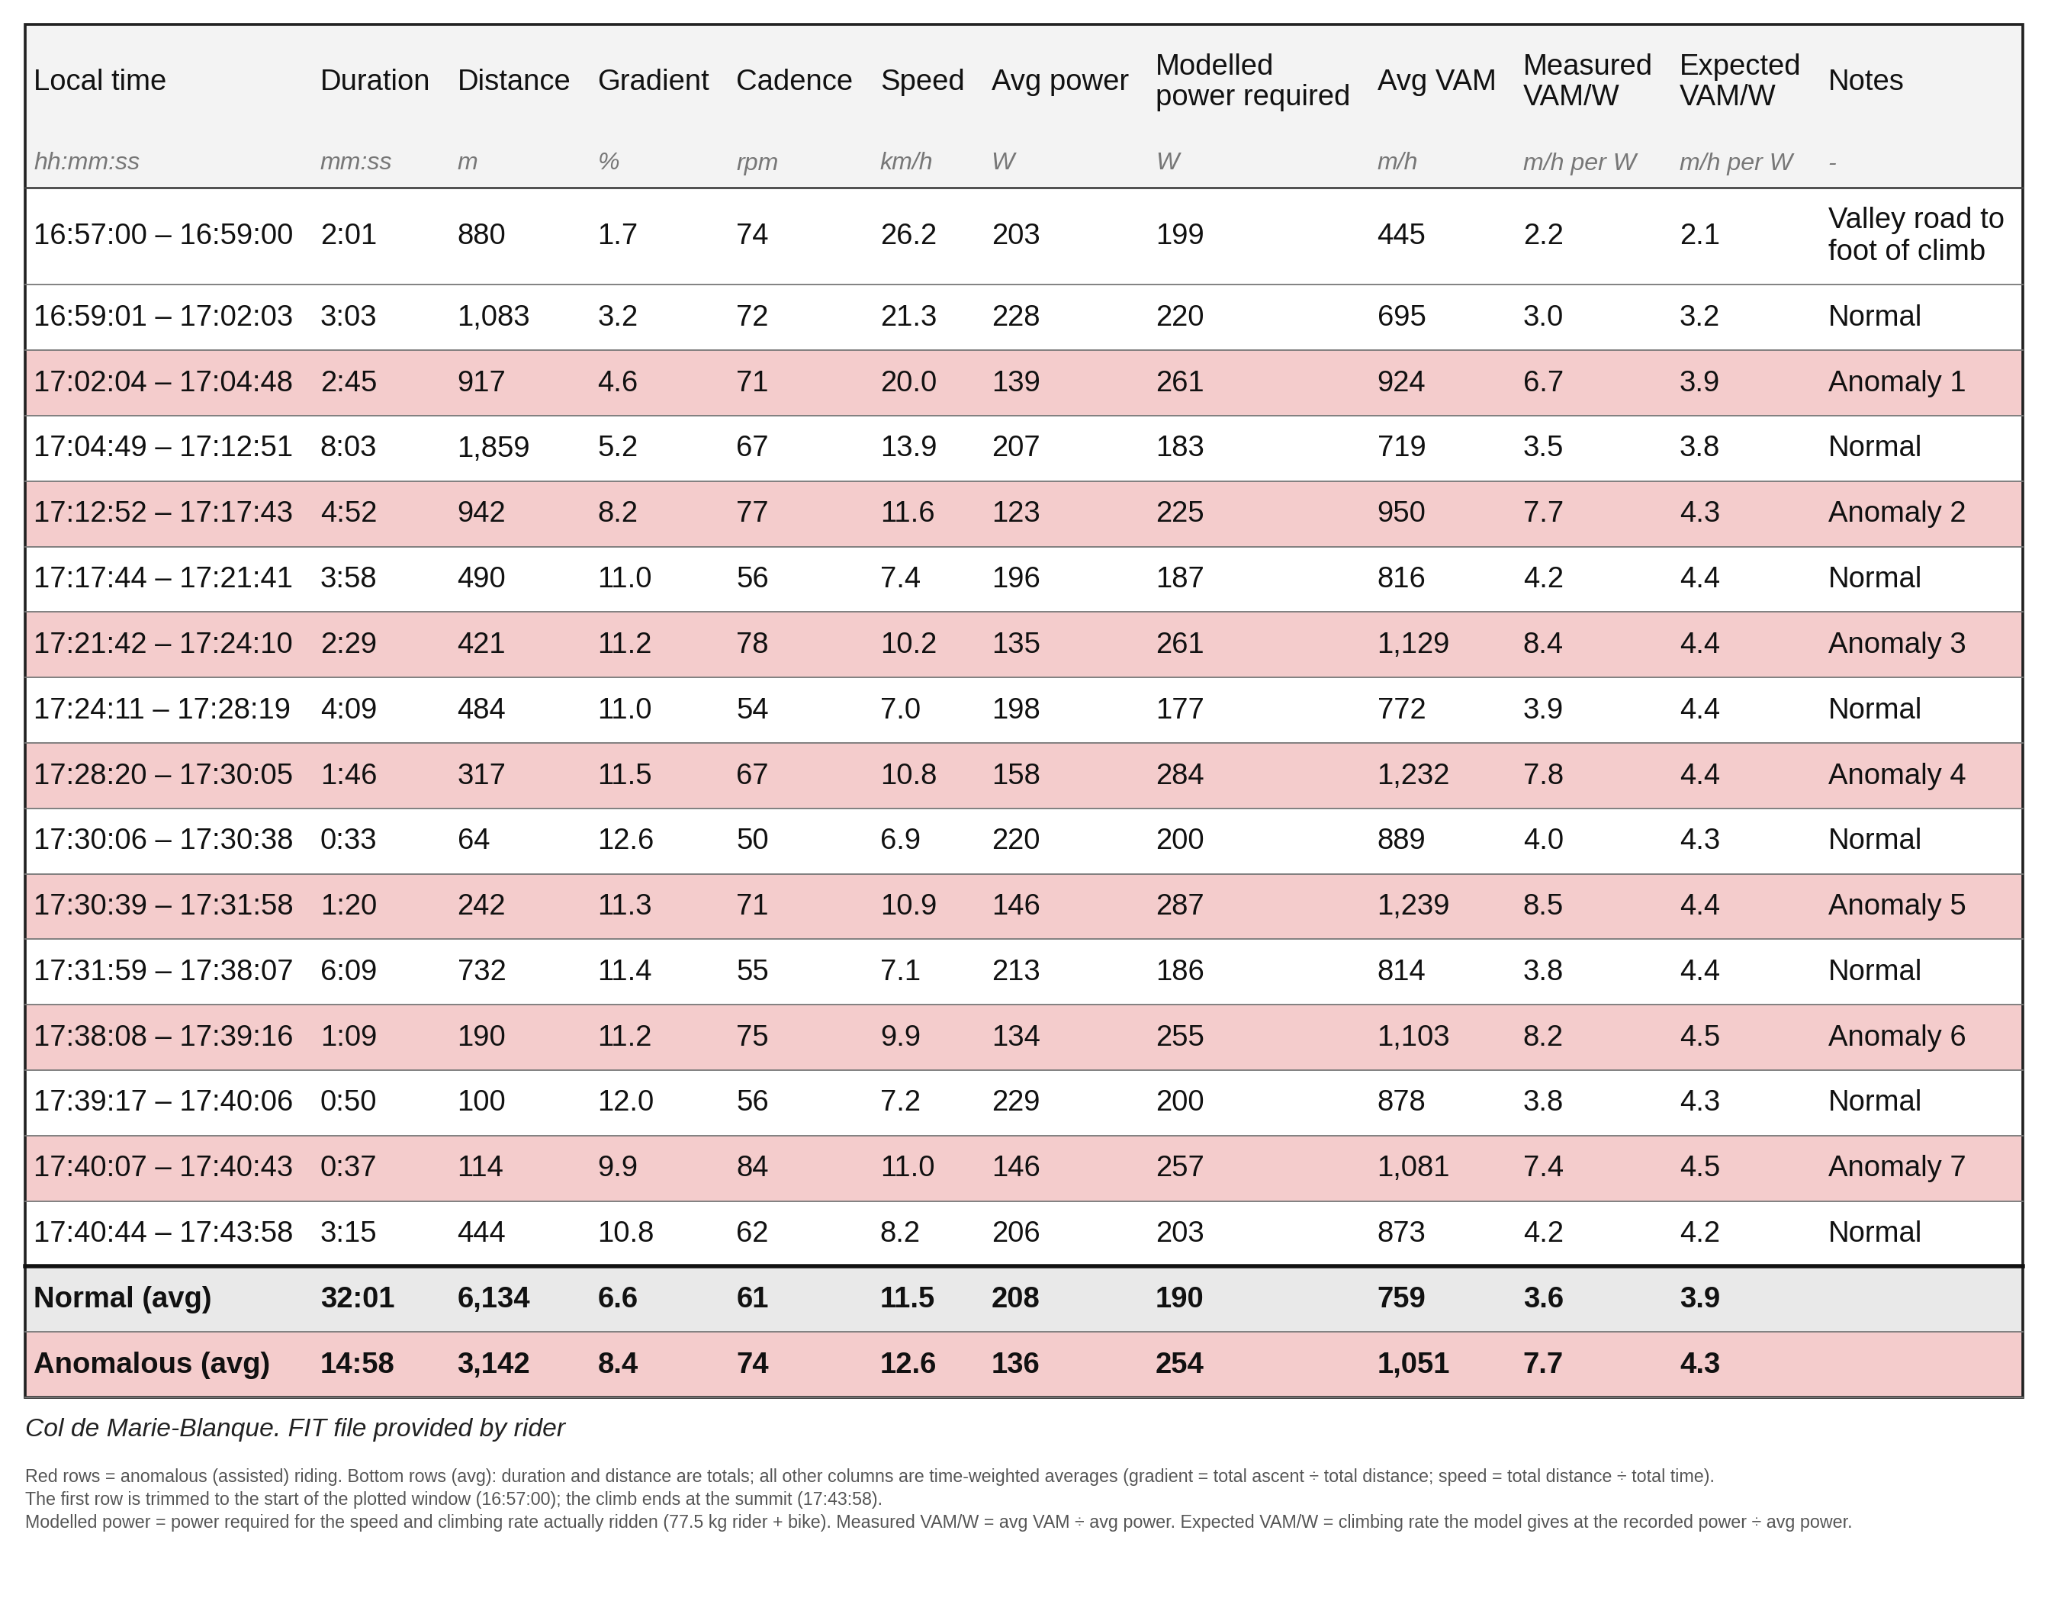
Table 2.4 shows climbing speed up the Col de Marie Blanque. As with the Aubisque climb actual speeds are roughly double what they should be for the recorded power input. Here we see the same pattern as on the Aubisque, of a rider going faster than physically possible for the amount of power output. The intermittent nature again suggests a rider dropping off a vehicle to let cars pass.
Annex B - Data inputs
The most obvious challenge to all of this evidence would be that the data output was faulty. However, as we can see that all of the data points agree and correlate, the data is proven to be accurate. Below we set out an analysis of the data collection from the Col d’Aubisque climb.
- GPS and speed agree. Distance measured from the GPS track over 18:55–19:15 matches the distance field to within 3 m out of 4.1 km. There are no GPS dropouts and no speed spikes.
- Altitude is smooth. It never moves more than 0.6 m per second, and the ~8% gradient matches the rest of the climb, so this isn’t a barometer glitch.
- The power meter looks healthy. Left/right balance stays at the same ~48/52 split as elsewhere, so there’s no sign of one side dropping out. Power and cadence keep responding normally through the sections, and this data is available for 99.4% of the rider’s TPR, showing no erroneous data. The Assioma pedals used are also known as the gold standard of power meters.
- Wind can’t explain it. At 12–15 km/h, aerodynamic drag is a small share of the effort. Even a strong tailwind couldn’t double climbing speed on an 8% grade, whereas we know that there was an approx 10km/h ENE wind, on largely E to ESE climbs.
Annex C - Rider’s right of reply
We put these findings to Max before publishing, and he suggested that the power meter must be providing faulty data. He also stated that the van he was seen holding onto on the Aubisque had almost knocked him off, and that the driver had spat in his face.
We gave him the opportunity to submit previous ride files which might show a malfunctioning power meter, but after checking these we conclude that the double-sided Assioma power meter was functioning correctly.
Around 14 further FIT Files were checked for power meter faults, with none of them showing any errors in data which could explain the TPRNo6 anomalies. Below is a sample of files checked:
19th July “TCR_.fit” - power meter functioning correctly apart from one dropout where all data stops transmitting. The rest of the data from this file is uncorrupted.
21st July “TCR_5.fit” - as above, power meter functioning except for one dropout.
21st September “night ride avec les zigues” - power meter functioning correctly
23rd September “Evening gravel ride” - power meter functioning correctly - analysis below:
Claude analysis for the 'Arreau gravel' FIT file from 23rd September 2026 (day before TPRNo6 registration):
Data quality
Nothing in the file looks like a faulty power channel. Checks that passed:
- Power and cadence agree. All 122 zero-power samples have zero cadence, and no sample has cadence without power. The zero runs (up to 25 s) match downhill coasting.
- No flatlines or spikes. No repeated power values, and no second-to-second jump above 250 W. The 20 samples above 400 W all occur on slow climbs (5.7 to 8.1 km/h, 63 to 75 rpm).
- Totals reconcile. Summed power (530,645 W-s) matches the device's accumulated power and its reported total work.
- Torque is plausible. It peaks at 67 Nm.
- Values are not doubled. 47% of readings are odd numbers, whereas a single-sided meter doubling one leg would give almost all even values. This suggests the data isn't single-sided doubled, though it isn't proof.
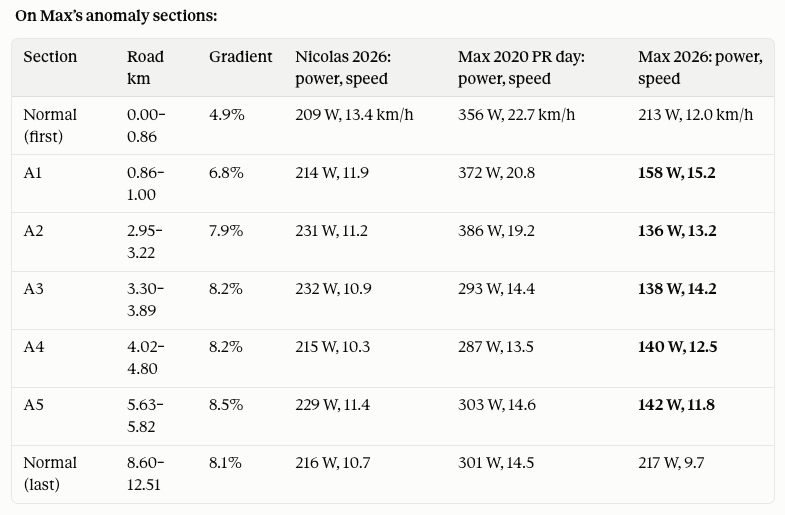
This table shows that the power meter was functioning as expected vs second placed Nicolas Chatelet’s speed and power on the Aubisque climb. The two normal segments (first and last) show almost identical power, with Max travelling slightly slower, indicating higher system weight. If nothing changed, and this was just a power meter malfunction, we would expect Max’s speed relative to Nicolas’ to remain fairly constant. However, for the normal segments, Nicolas is riding slightly faster, but for the anomalous segments (where power dips) Max starts moving faster each time. The following table strips out the power data and shows speed comparison alone.
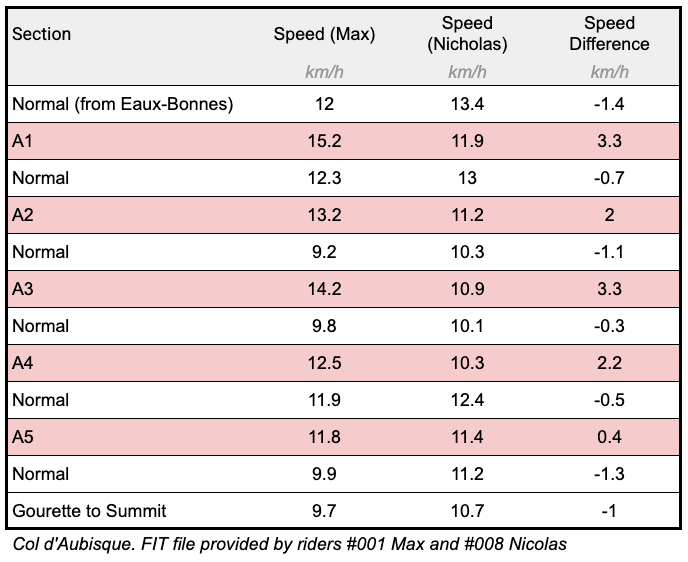
If we take power out of the equation, we still see a clear pattern. On the normal riding sections, Max’s speed is reliably slightly below Nicolas’. On the anomalous sections, Max’s speed is always slightly above Nicolas’. This disproves the anomalies could have been caused by power meter error, unless we are to believe that these power meter errors also always coincide with an increase in speed. A much more credible explanation is that Max had assistance for these sections.